Project Name: Redesigned Mobile and Device Interface for the High-End Google Nest Thermostat
Project Name: Redesigned Mobile and Device Interface for the High-End Google Nest Thermostat
Project Name: Redesigned Mobile and Device Interface for the High-End Google Nest Thermostat
Project Name: Redesigned Mobile and Device Interface for the High-End Google Nest Thermostat
Role
Role
Role
Role
UX | UI Designer
Wireframing & Prototyping
Low/High-Fidelity Mockup
UX | UI Designer
Wireframing & Prototyping
Low/High-Fidelity Mockup
UX | UI Designer
Wireframing & Prototyping
Low/High-Fidelity Mockup
UX | UI Designer
Wireframing & Prototyping
Low/High-Fidelity Mockup
Timeline
Timeline
Timeline
Timeline
2 month
April 2024 - June 2024
2 month
April 2024 - June 2024
2 month
April 2024 - June 2024
2 month
April 2024 - June 2024
Tool
Tool
Tool
Tool
Figma
Adobe Photoshop
Figma
Adobe Photoshop
Figma
Adobe Photoshop
Brief
Brief
Brief
Brief
This project involved redesigning a high-end, innovative version of the Google Nest thermostat for both the mobile app and device. It was inspired by the less-than-ideal user experience due to unclear navigation and limited customization. The redesign focused on key features, including a more intuitive homepage temperature display, an enhanced calendar schedule, and improved energy usage tracking, offering tech-savvy users a more personalized and seamless experience.
This project involved redesigning a high-end, innovative version of the Google Nest thermostat for both the mobile app and device. It was inspired by the less-than-ideal user experience due to unclear navigation and limited customization. The redesign focused on key features, including a more intuitive homepage temperature display, an enhanced calendar schedule, and improved energy usage tracking, offering tech-savvy users a more personalized and seamless experience.
This project involved redesigning a high-end, innovative version of the Google Nest thermostat for both the mobile app and device. It was inspired by the less-than-ideal user experience due to unclear navigation and limited customization. The redesign focused on key features, including a more intuitive homepage temperature display, an enhanced calendar schedule, and improved energy usage tracking, offering tech-savvy users a more personalized and seamless experience.
Key Challenges
Key Challenges
Key Challenges
Key Challenges
1. Confusing Information Architecture and Navigation: Repetitive room information and lack of structure make it difficult for users to distinguish room data. Users struggle to navigate and control the correct room settings.
2. Unappealing Visual Design: The interface lacks personalization options and a modern aesthetic for tech enthusiasts.
Goals
Goals
Goals
Goals
Reorganize information architecture to make navigation clear and intuitive.
Adopt a minimalist design with visual simplicity and improved data visualization for a more modern, appealing interface.
Provide personalized advice and suggestions to enhance user engagement and satisfaction.
Highlight
Highlight
Highlight
Highlight
Feature 1 - Adjust Current Temperature
Feature 1 - Adjust Current Temperature
Feature 1 - Adjust Current Temperature
Feature 1 - Adjust Current Temperature
Major Challenge:
The previous interface displayed dense information, with temperature, humidity, and mode settings mixed together, making it difficult for users to focus on core functions. The circular dial with arrow misleading users. The highly saturated blue background hindered the quick identification of key data. Additionally, users had to manually navigate through ECO, FAN, and SCHEDULE modes in the bottom menu to make adjustments, resulting in a lengthy interaction process. The most important is that It lacks AI recommendations and personalized features compared with other projects of similar prizes.
This is the most challenging part of this project, so I created plans A, B, C and compared their pros and cons, here is how I solved it:
BEFORE
BEFORE
BEFORE
BEFORE
BEFORE
BEFORE
BEFORE
BEFORE
PLAN - A
Pros:
1. Show large current temperature first
Use circular dial scale shows the position of adjust temperature
Have scheduled temperature ranges as reference
AI-driven one-click apply suggestion
The current and adjustable temperature are more intuitive to remind users while they are changing temperature
Cons:
Mode button not super clear enough
Temperature ranges components not obvious enough

BEFORE
BEFORE
BEFORE
BEFORE
BEFORE
BEFORE
BEFORE
BEFORE
PLAN - B
Pros:
Use circular dial scale shows the position of adjust temperature
Have scheduled temperature ranges as reference
AI-driven one-click apply suggestion
Keep putting adjustable temperature in the middle without changing content to confuse users
Cons:
Mode button not super clear enough
Temperature ranges components not obvious enough
Current temperature is not intuitive
PLAN - C
Pros:
All functions in one page
Easy to switch rooms
More beautiful
Cons:
Cannot see all rooms in one time
Cannot show large current temperature to remind users before changing temperature
Mode button not super clear enough
No temperature ranges
The circular dial is useless, using button instead of it
All in all, I chose Plan A at the end. It maximizes the effect of the circular dial and has the best interactive experience by switching the current and adjustable temperature when users adjust the temperature.
Although Plan B keeps putting adjustable temperature in the middle without changing content to confuse users, but it lowers the readability of the current temperature. Plan C has the most concise interface but the cons are fatal.
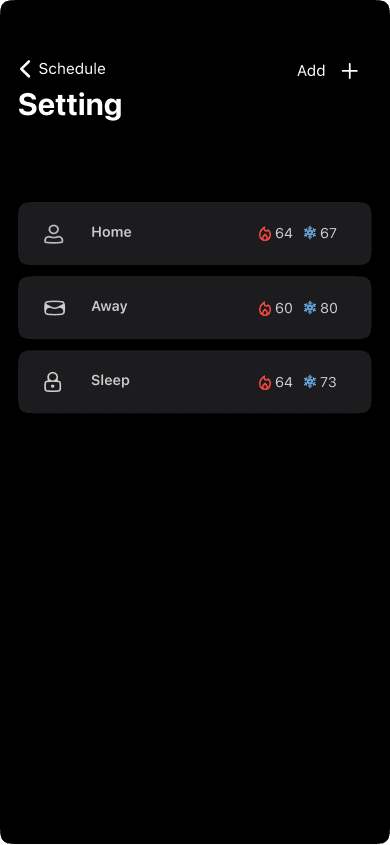
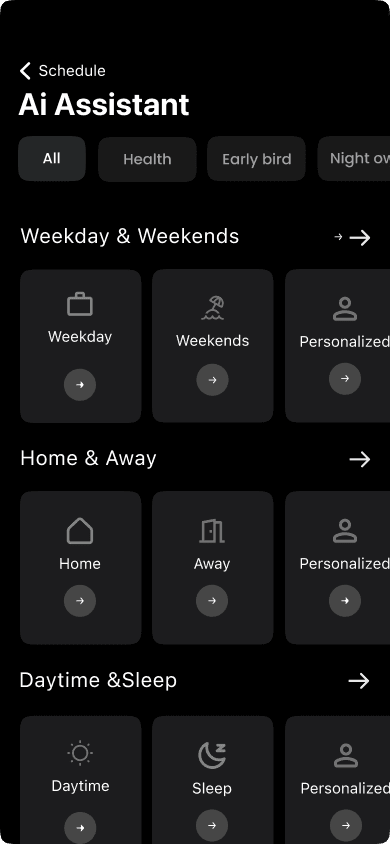
Feature 2 - Room Scheduled Temperature
Feature 2 - Room Scheduled Temperature
Feature 2 - Room Scheduled Temperature
Feature 2 - Room Scheduled Temperature
BEFORE
BEFORE
BEFORE
BEFORE
AFTER
AFTER
AFTER
AFTER

Optimized Temperature Scheduling Interface: Improved information categorization and enhanced scheduling efficiency.
Major Challenge:
In the original experience, the grid layout lacked data visualization and clarity, leading to an unintuitive interaction for adjusting and setting temperatures. This made room temperatures prone to overlapping and made it difficult to distinguish set time periods.
For example, inconsistent room information often caused users to mistakenly control the wrong room due to similar interface designs, negatively impacting the user experience. Additionally, key functions—such as temperature adjustment, mode selection, and time scheduling—were scattered across different sections, making them difficult to access quickly.
The unclear interface led to user confusion, as they frequently adjusted the wrong room’s temperature, reducing overall efficiency. The high learning curve required new users to spend extra time understanding the interface logic, while the lack of clear navigation contributed to frustration, ultimately decreasing user satisfaction.
The biggest challenge I faced was discovering that users wanted to view the current temperature, set temperature, and the duration of the set temperature for different rooms all at once, without constantly switching pages.
Solutions:
Added a new “Add Schedule” entry to ensure core features are easy to find and use.
Visualized room temperature information by introducing room cards displaying room icons, current temperature, and time periods, making information easy to understand at a glance.
Fluorescent color icons enhanced visual recognition, making it more intuitive than text-only content while ensuring consistency across sub-pages. Time-Temperature XY Axis View enabled users to manage temperature changes more intuitively, reducing cognitive load.
Enhanced Interaction Efficiency: Allowed users to drag and adjust the temperature curve directly, reducing repetitive inputs and improving usability. Provided a weekly toggle option to easily compare temperature changes over time.
These improvements streamlined the scheduling process, reduced user errors, and improved overall efficiency, leading to a more intuitive and satisfying experience.
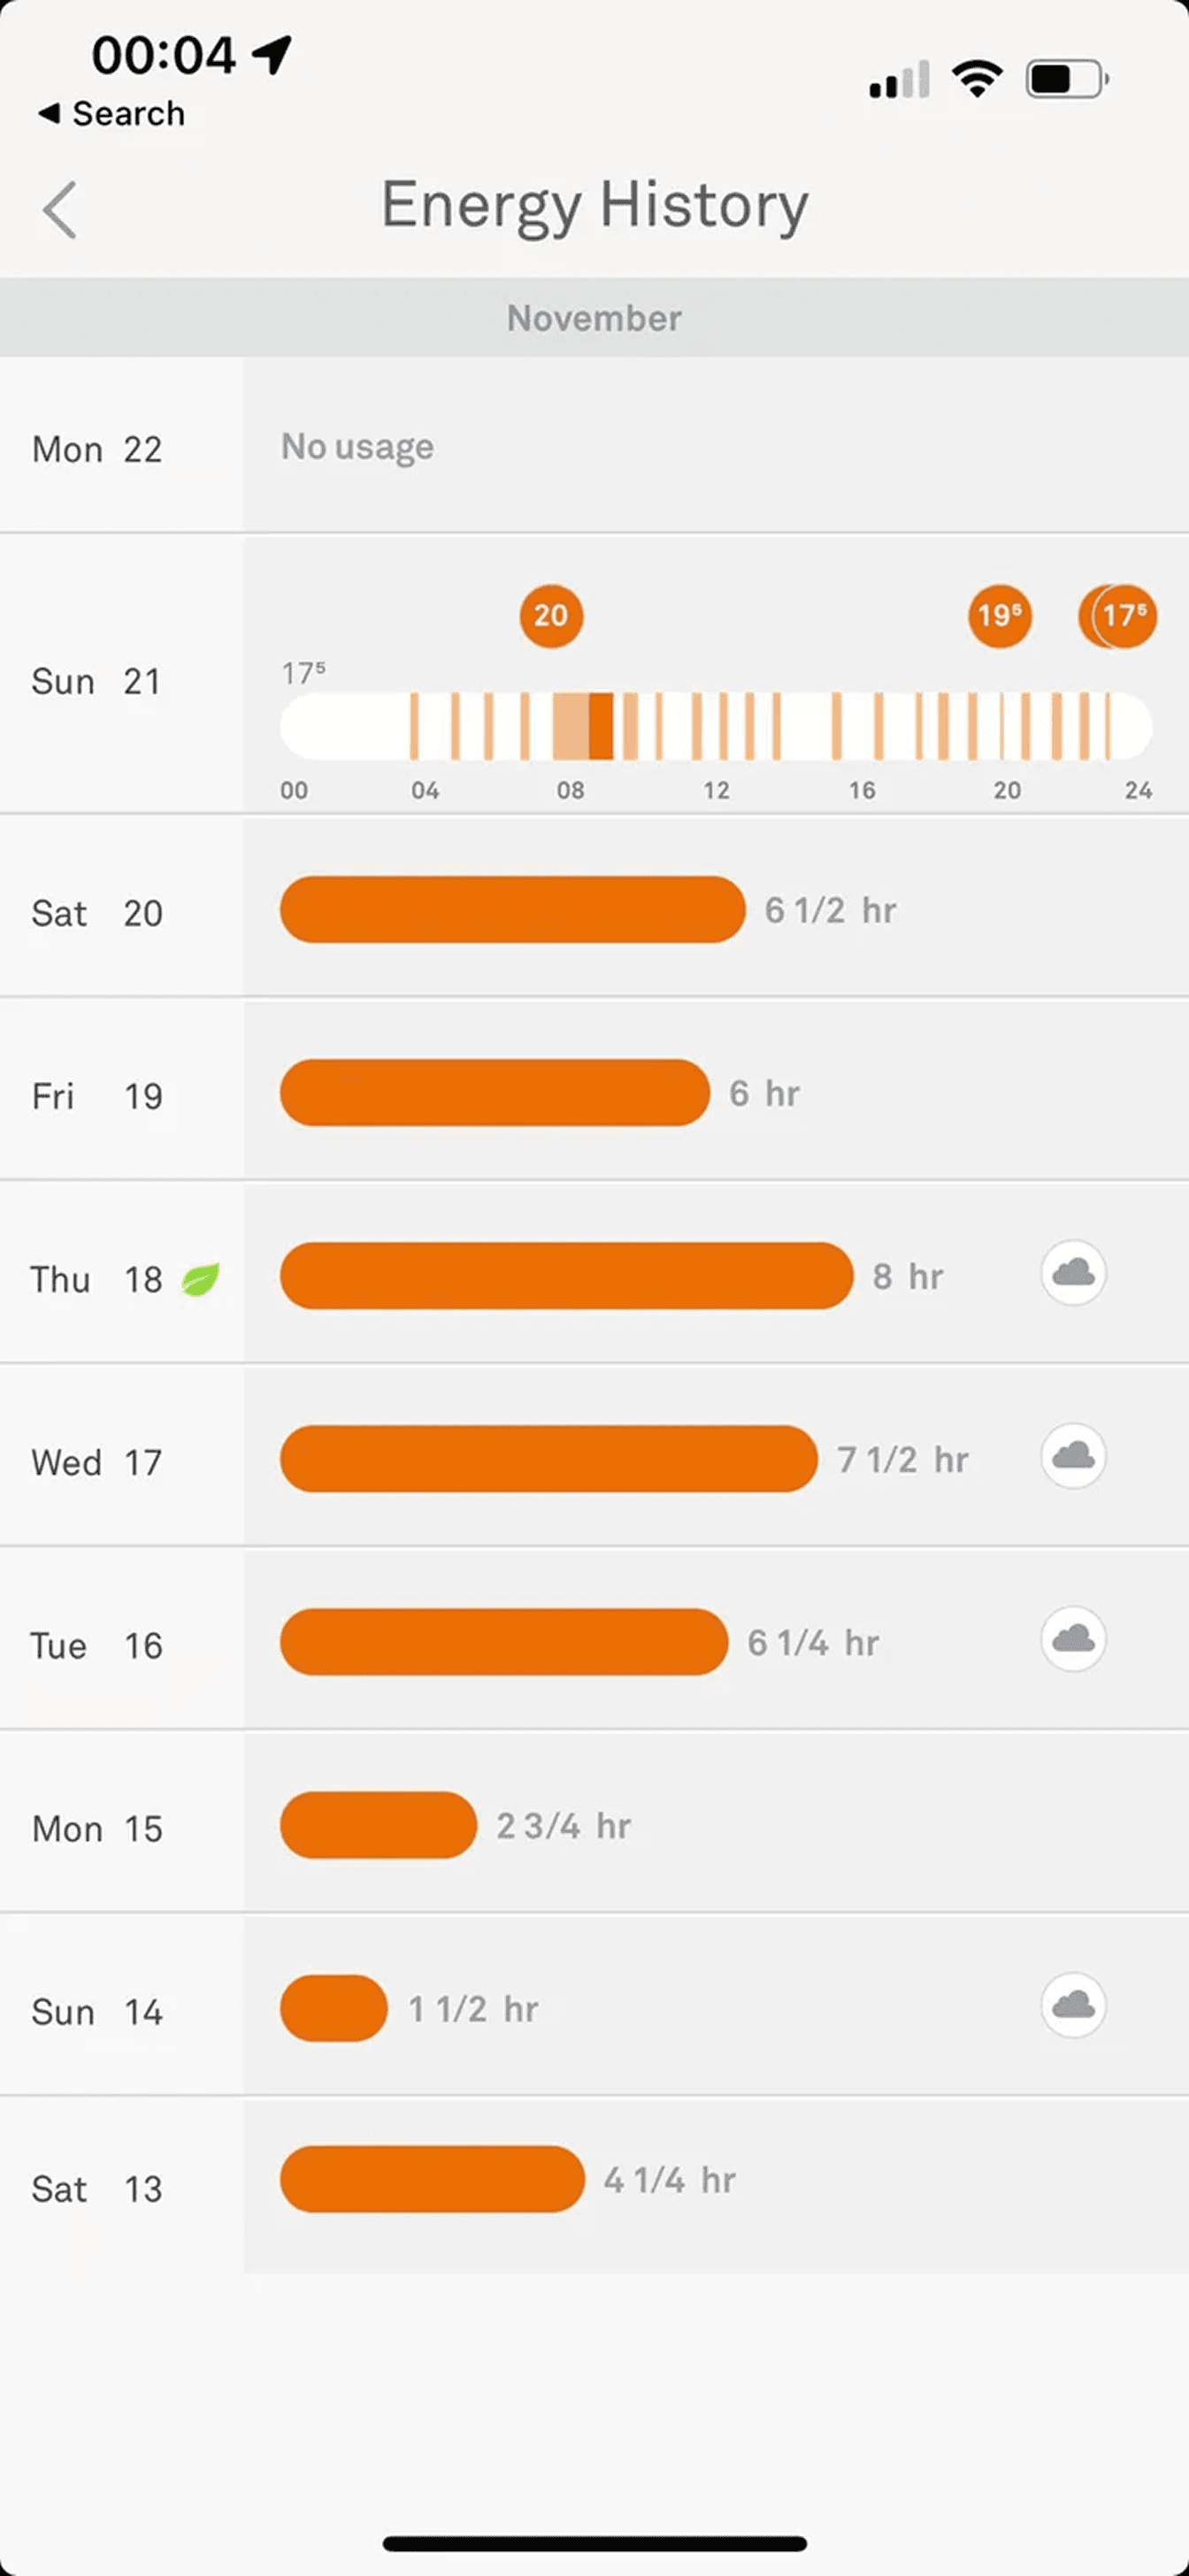
Feature 3 - Energy Use
Feature 3 - Energy Use
Feature 3 - Energy Use
Feature 3 - Energy Use
BEFORE
BEFORE
BEFORE
BEFORE
AFTER
AFTER
AFTER
AFTER


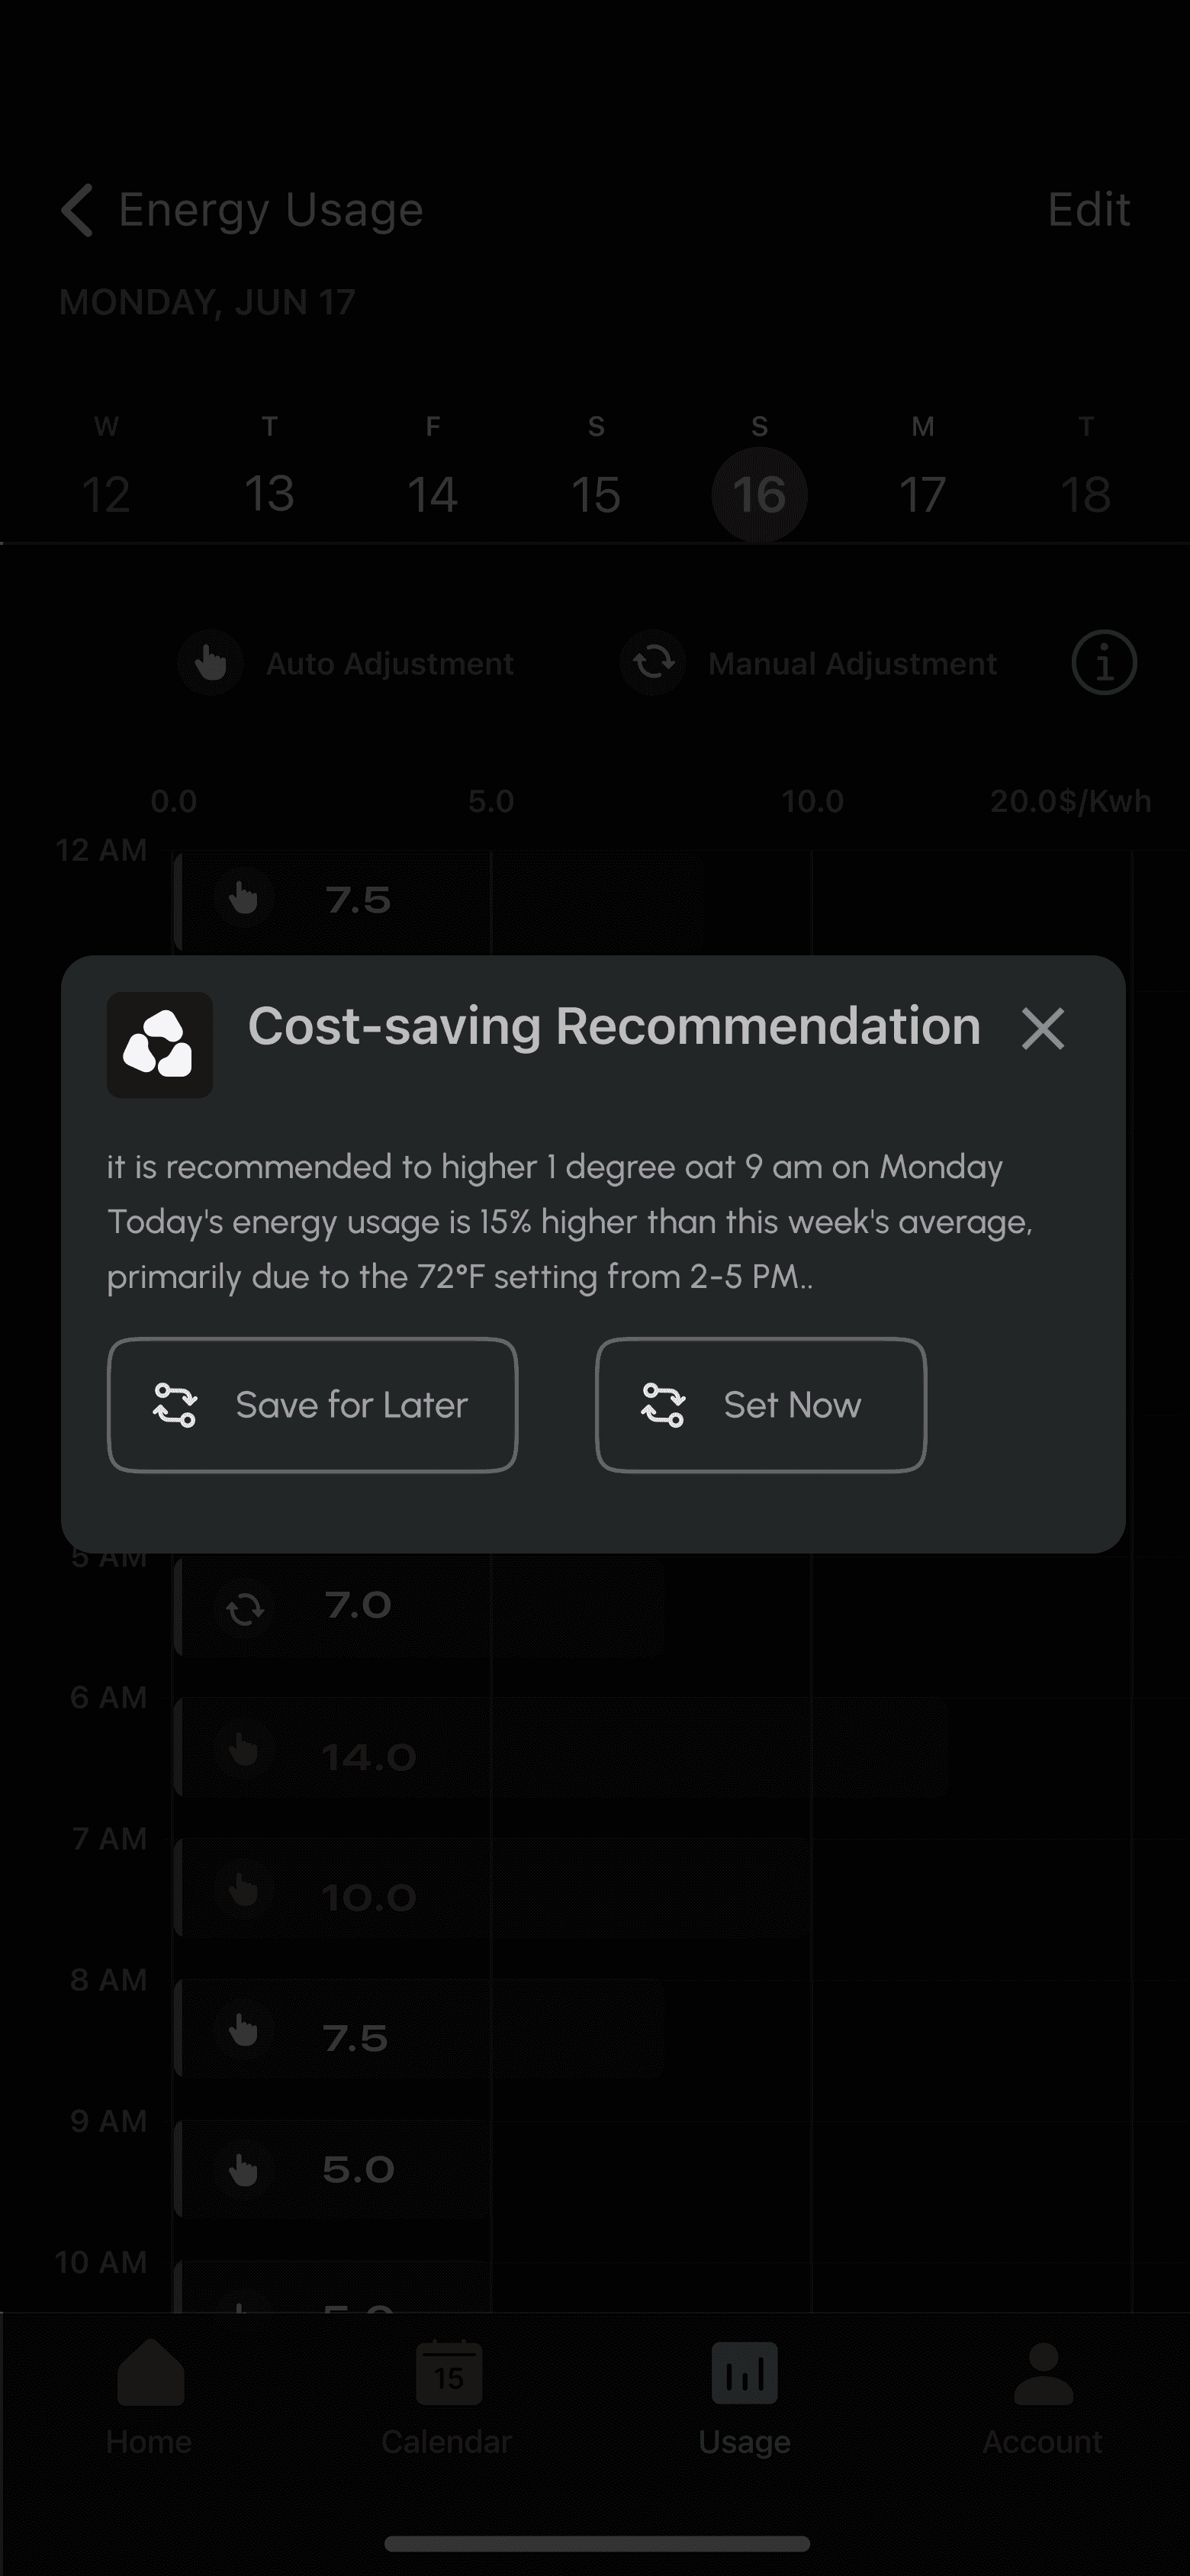
Improving the "Energy Usage" Interface: Offer More Intuitive Data and Actionable Energy-Saving Suggestions
Major Challenge:
The current interface only displays daily electricity usage duration using bar charts + hours, which, while clear, does not provide insights into actual energy costs or high-consumption periods.
Energy data is difficult to interpret cause the system only provides "usage duration" (hours), whereas high-end users are more concerned about cost rather than time.
Information hierarchy is disorganized, lacking color coding, making it difficult for users to quickly identify high-energy consumption periods.
Energy-saving suggestions are too generic: The system only provides broad energy-saving reminders, leaving users unsure about specific optimization steps.
Solutions:
Adopting More Intuitive Data Visualization: Replace simple progress bar indicators with bar charts to better visualize daily energy consumption trends. Use dual-unit display (kWh and cost in $) to help users understand consumption costs rather than just electricity usage duration.
Refining Hourly Energy Consumption Data and Highlighting High-Consumption Periods: Display specific hourly consumption on the timeline (e.g., 7.5 kWh, 14.0 kWh) to allow users to clearly see which periods consume the most energy.
Implement color coding to enhance readability: White represents normal consumption, red indicates high energy consumption, and automatic vs. manual temperature adjustment is distinguished using icons (tooltip in the upper right corner provides explanations).
Adding a Smart Analysis Prompt Box (Highlighted in Red)to help users understand why energy consumption is high, for example:"Today's energy usage is 15% higher than this week's average, primarily due to the 72°F setting from 2-5 PM.""Your temperature control habits favor constant temperature mode more than 80% of users, which may result in higher energy costs." This information guides users to optimize their scheduling settings or AI preferences instead of blindly reducing energy consumption.
Design Process
Design Process
Design Process
Design Process
Competitor Analysis
Competitor Analysis
Competitor Analysis
Competitor Analysis
UI/Interaction Pattern Analysis
UI/Interaction Pattern Analysis
Visual Research
Visual Research
Usability Testing
Usability Testing
Usability Testing
Usability Testing
Interview
Interview

Information Architecture
Information Architecture
Information Architecture
Information Architecture

User Flow - Homepage
User Flow - Homepage
User Flow - Homepage
User Flow - Homepage
User Flow - Schedule Page
User Flow - Schedule Page
User Flow - Schedule Page
User Flow - Schedule Page

User Flow - Energy Use Page
User Flow - Energy Use Page
User Flow - Energy Use Page
User Flow - Energy Use Page

Ideation
Ideation
Ideation
Ideation
Phone Low -Fidelity Wireframes
Phone Low -Fidelity Wireframes
Phone Low -Fidelity Wireframes
Phone Low -Fidelity Wireframes
Device Low -Fidelity Wireframes
Device Low -Fidelity Wireframes

Design Style
Design Style
Design Style
Design Style

Components
Components
Components
Components

Prototype
Prototype
Prototype
Prototype
Usability Testing
Usability Testing
Usability Testing
Usability Testing